Posted to News on 29th Nov 2011, 21:37
Tutorial: machine vision test charts explained
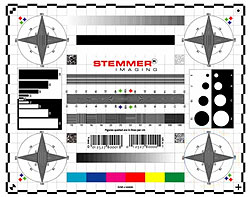
Stemmer Imaging has created a short video that explains the various graphical devices on its test chart and how they are used to assess different features of machine vision components and systems.

The tutorial video is presented by Dr Jonathan Vickers, the Technical Manager at Stemmer Imaging, who discusses the Stemmer Imaging test chart. Anyone who has a copy of the company's Imaging and Machine Vision Handbook will have seen an A4 version of the test chart on the back cover, or A3 copies can be requested [the Handbook is now also available for mobile devices - Ed]. To the uninitiated, the various monochrome and colour graphics are likely to be meaningless, but Dr Vickers explains the markings and their purposes when calibrating, assessing and configuring cameras, lenses and machine vision systems.
This and further machine vision tutorials are available to view on the Stemmer Imaging YouTube channel.


